We are back with the second edition of our ‘CRO Perspectives: Conversations with Industry Experts’ VWO Blog series. Through these…
Pratyusha Guha
12 Min Read
Wouldn’t it be great if picking the right business tool was as easy as trying…
Ketan Pande
12 Min Read
We’re truly grateful for the recognition from our customers. The G2 Spring 2024 reports have…
Ketan Pande
4 Min Read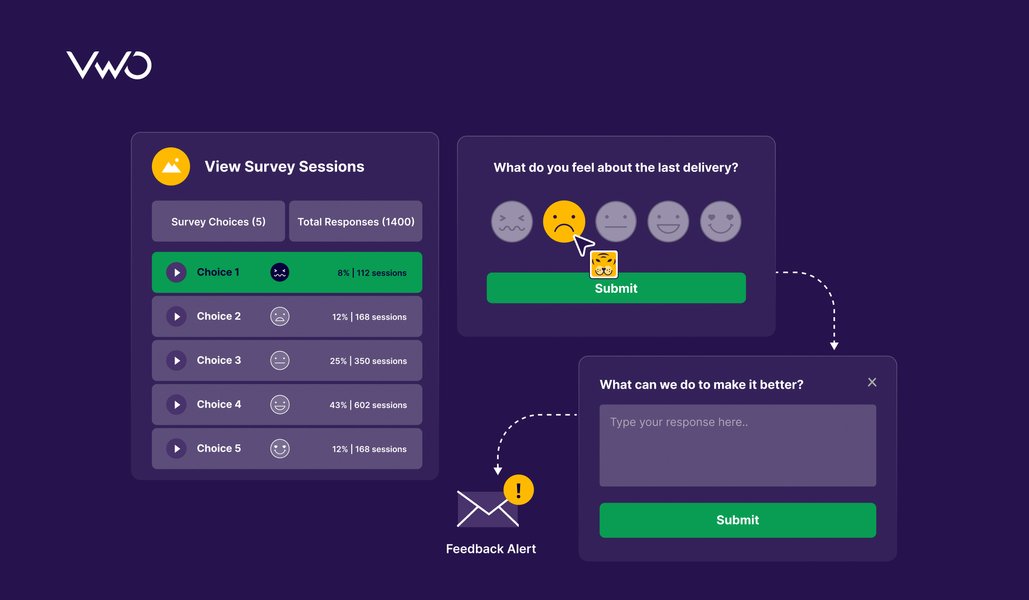
In 2005, Dell faced a crisis when Jeff Jarvis, a regular internet user, publicly criticized…
Pratyusha Guha
10 Min Read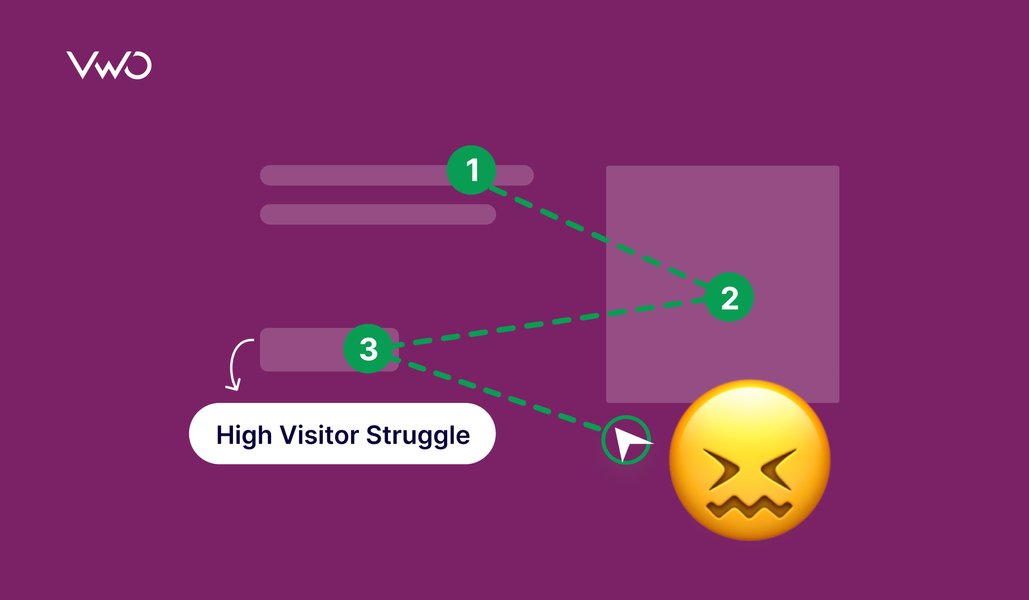
No customer has the exact same journey on your website. While they may follow similar…
Ashley Bhalerao
15 Min Read
This interview is part of our ‘CRO Perspectives: Conversations with Industry Experts’ VWO Blog series.…
Pratyusha Guha
10 Min ReadSometimes the most important piece of information on your webpage is similar to undiscovered treasure…
Pratyusha Guha
15 Min Read
Adam Ruse, UI/UX designer at IMB Bank, a respected financial giant in Australia, spearheaded efforts…
Ketan Pande
6 Min Read
Amazon, Domino’s, Zalora, Apple – What connects these eCommerce giants across diverse industries? They’ve woven…
Pratyusha Guha
15+ Min Read
“Keep ’em hooked!” That’s probably the mission statement of every single streaming platform we have…
Ashley Bhalerao
12 Min Read
Join our community of 10,000+ Marketing, Product & UX Folks today & never miss the latest from the world of experience optimization.
Talk to a sales representative
Free for 30 days. No credit card required
Awesome! Your meeting is confirmed for at
Thank you, for sharing your details.
I can't wait to meet you on at

, thank you for sharing the details. Your dedicated VWO representative, will be in touch shortly to set up a time for this demo.
We're satisfied and glad we picked VWO. We're getting the ROI from our experiments.
Christoffer Kjellberg CRO Manager
VWO has been so helpful in our optimization efforts. Testing opportunities are endless and it has allowed us to easily identify, set up, and run multiple tests at a time.
Elizabeth Levitan Digital Optimization Specialist
As the project manager for our experimentation process, I love how the functionality of VWO allows us to get up and going quickly but also gives us the flexibility to be more complex with our testing.
Tara Rowe Marketing Technology Manager
You don't need a website development background to make VWO work for you. The VWO support team is amazing
Elizabeth Romanski Consumer Marketing & Analytics Manager


Awesome! Your meeting is confirmed for at
Thank you, for sharing your details.


