A/B Test Statistical Significance Calculator [Free Excel]
The statistics of A/B testing results can be confusing unless you know the exact formulas. Earlier, we had published an article on the mathematics of A/B testing and we also have a A/B test statistical significance calculator on our website to check if your results are significant or not.
The calculator provides an interface for you to calculate your A/B test’s statistical significance but does not give you the formulas used for calculating it. The article, on the other hand, provides an introduction to A/B testing statistics and talks about the math that goes behind A/B split testing and the importance of statistical significance.
Download Free: A/B Testing Guide
VWO’s A/B testing solution helped retail company Greene improve their revenue by almost 60%. However, A/B tests can be tricky to execute and interpret. So, unless you believe in predicting A/B test results using Indian astrology, this blog will tell you the math behind easy calculation of statistical significance of your tests.
The ‘what’, ‘why’ and ‘how’ of statistical significance
Before we move to complex statistical significance formulas, let’s first understand what it is, why it is important, and how to ensure that your tests conclude with statistical significance.
What is statistical significance?
Statistical significance is nothing but the probability that the gap between conversion rates of any chosen variation and the control is not because of random chance but due to a well planned, data-backed process. In this data backed process, you first gather user insights on how they are interacting with your website and then use the gathered data to formulate a scientific testing hypothesis.
Your significance level also reflects your confidence level as well as risk tolerance.
For instance, if you run an A/B test with 80% significance, while determining the winner you can be 80% confident that the results produced are not a product of any random hunch or chance. Moreover, 80% significance also reflects that there is a 20% chance that you may be wrong.
Why is statistical significance important?
For A/B testing to be successful, the test results should be statistically significant. You cannot tell for certain how future visitors will react to your website. All you can do is observe the next few visitors, record their behavior, statistically analyze it, and based on that, suggest and make changes to optimize the experience of the next users. A/B testing allows you to battle the aforementioned uncertainty and improve your website’s user experience provided each and every step is planned considering each variable in play like total website traffic, sample traffic, test duration and so on. A good example of this is Germany based company Dachfenster-rollo.de that improved their conversion rate by 33% by A/B testing their user experience.
Your marketing team’s quest for exact predictions about future visitors and the inherent uncertainty in making such predictions necessitates statistical significance. Statistical significance is also important because it serves as a source of confidence and assures you that the changes you make do have a positive impact on your business goals.
How to ensure the statistical significance of a test?
Statistical significance depends on 2 variables:
- The number of visitors, i.e your sample size.
- The number of conversions for both control and variation(s).
To ensure that your A/B tests conclude with statistical significance, plan your testing program keeping both these variables in mind. Use our free A/B test significance calculator to know your test’s significance level.
Download Free: A/B Testing Guide
How to calculate statistical significance in excel sheet with A/B testing formulas?
We have come up with a FREE spreadsheet which details exactly how to calculate statistical significance in an excel. You just need to provide the number of visitors and conversions for control and variations. The excel calculator automatically shows you the significance, p-value, z-value and other relevant metrics for any kind of A/B split testing (including Adwords). And, to add to our article on the mathematics of A/B testing and free A/B test statistical significance calculator, we share the A/B testing significance formula in excel for calculating test result significance.
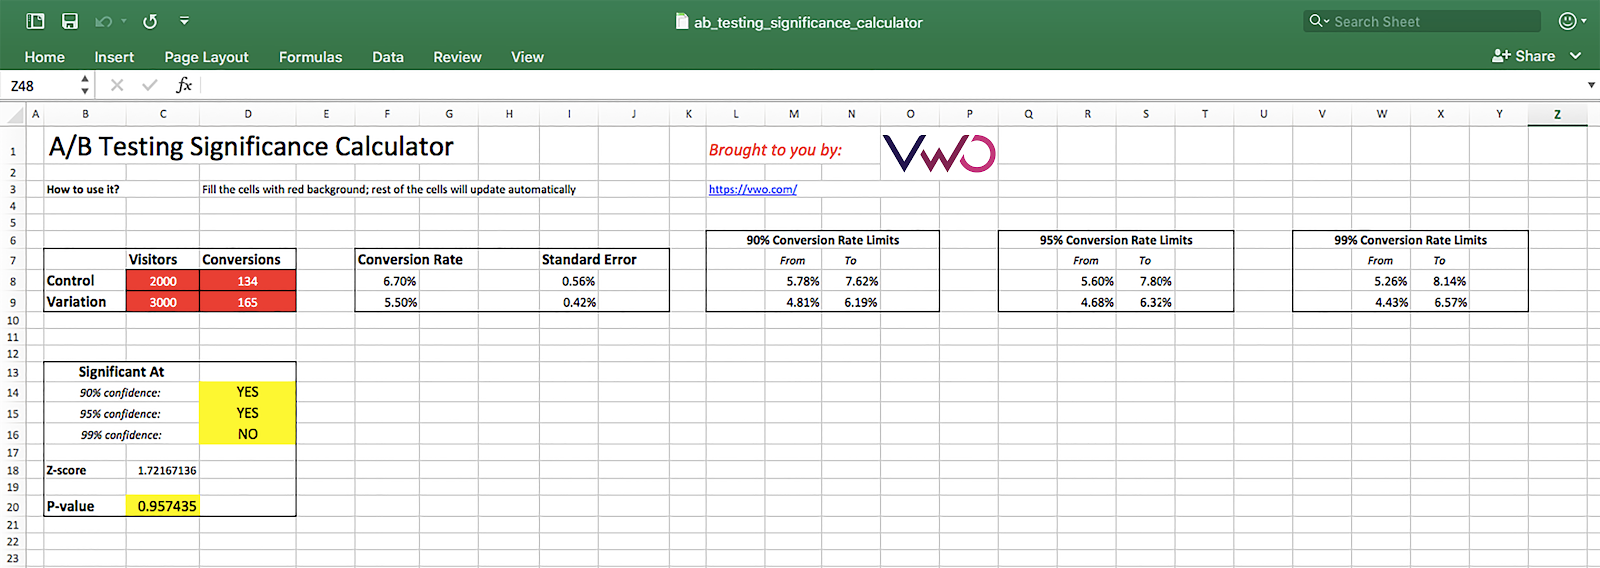
Click here to download the A/B testing significance calculator (excel sheet)
Please feel free to share the file with your friends and colleagues or post it on your blog and social media handles.
PS: By the way, if you want to do quick calculations, we have a version of this A/B testing significance calculator hosted on Google Sheets
(You will have to make a copy of the Google sheet into your own Google account before you make any changes to it).
At VWO, we believe that understanding the statistics behind A/B testing should not be your headache. Your tool should take care of this. If you’d like to try VWO SmartStats that offers intuitive and intelligent reports of your A/B tests, take a guided free trial.

Frequently asked questions
The p-value or probability value is a statistical measurement that helps determine the validity of a hypothesis based on observed data. Typically, a p-value of 0.05 or lower is commonly accepted as statistically significant, suggesting strong evidence against the null hypothesis. When the p-value is equal to or less than 0.05, it tells us that there’s good evidence against the null hypothesis and supports an alternative hypothesis.
A p-value of 0.05 indicates a commonly accepted threshold for statistical significance in an excel. This signifies that there is a 5% chance that the observed result is due to random chance and the null hypothesis is true. If the p-value is less than or equal to 0.05, it serves as an evidence against the null hypothesis and supports the alternative hypothesis. For instance, you have two data sets, A and B, and you determine the statistical difference between their means. By calculating statistical significance in an excel, you get a p-value of 0.03. With this result, you can conclude that the data gives you strong evidence to reject the null hypothesis and the significant difference between data set A and B.
Simply put, the p-value can be thought of as a “probability of chance”. It quantified the likelihood of getting the observed results by random chance, assuming that there is no actual difference between the means of two data sets. A lower p-value means that the results are less likely to be due to chance or more likely to indicate a meaningful effect.
However, the interpretation of the p-value must be considered along with other factors like sample size, test, duration, context of the research, and so on to reach statistically significant results.
While you can use the A/B testing significance formula in excel, we suggest you try our A/B test statistical significance calculator. Using this free calculator, you can get accurate calculations without spending too much time to obtain the statistical significance. In fact, you can spend the saved time on other critical activities like hypothesis formulation, test result analysis, and user behavior research. After all, why worry when you select the right tool to do the job on your behalf?
Categories: