How to Achieve Lead Generation, Seamless Content Conversion, and Navigation Bliss Using VWO Insights-Web
Website analytics is like a collection of numbers that can tell stories of success or failure. If things aren’t going well, it’s time to play detective. Grab your magnifying glass and dig into the data to uncover what’s really happening.
There could be many reasons for decreasing conversions and low click-through rates. In this blog, we’ll concentrate on three common scenarios that might be causing issues, regardless of your industry.
i. Form flow woes: You have a multi-field form to generate leads, but it’s not performing well and falling short of achieving the business objective of lead generation.
ii. Engagement deficit: Your content isn’t engaging and converting visitors to leads.
iii. Navigation flaws: Users struggle to find products from your navigation menu that has multiple categories.
Before making alterations to the current user experience or launching A/B tests to address these issues, it’s crucial to have a precise understanding of what’s going wrong. The figures derived from a web analytics tool merely serve as symptoms; uncovering the root cause of the problem involves delving into the user experience when they decide not to convert. This is precisely where a behavior analytics tool proves to be invaluable.
So, how can a comprehensive tool like VWO Insights-Web with vast application assist in tackling these three challenges? Let’s delve into it with the help of three case studies featuring high-growth businesses that successfully overcame these issues using the tool.
Note: Here’s a guide for you to refer to when you come across various features of VWO Insights-Web in this blog. It provides details of how these VWO features work cohesively for behavior analysis.
Success stories: How brands harness VWO Insights-Web to transform challenges into triumphs
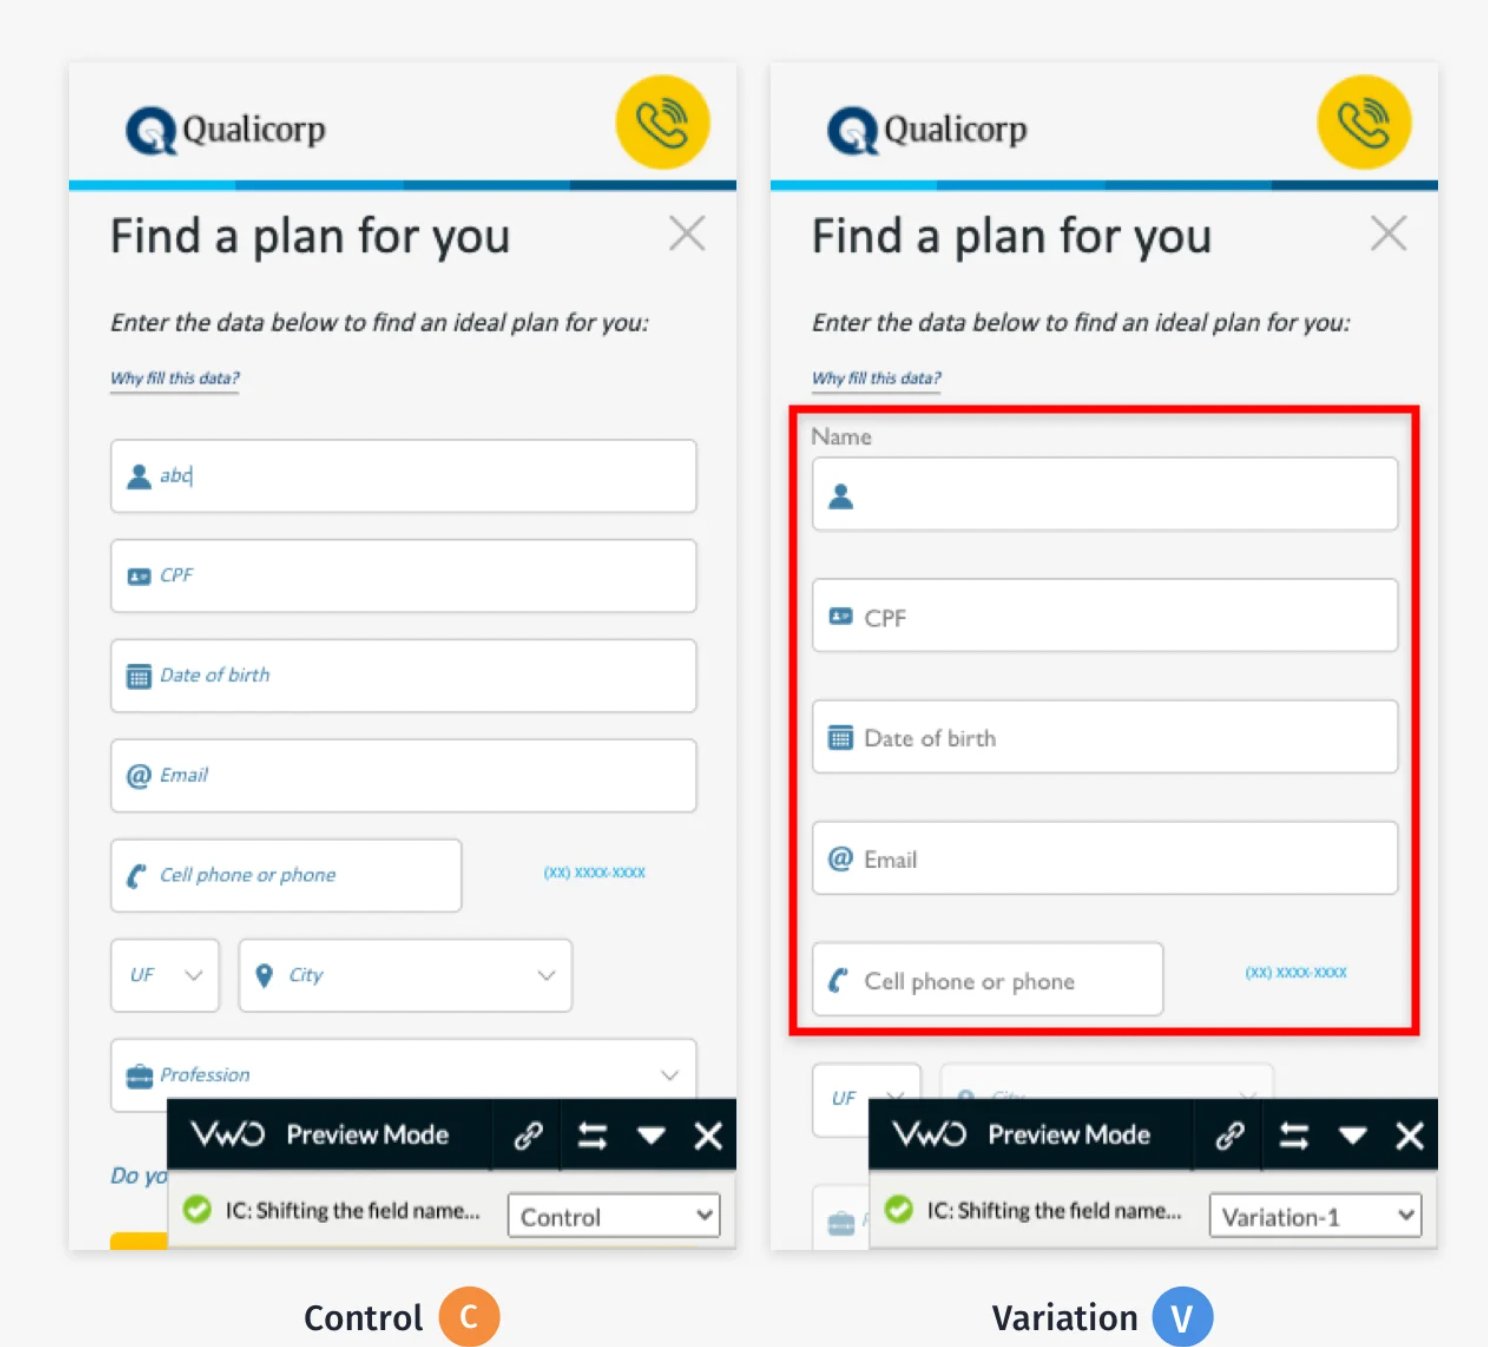
Qualicorp discovered a form-filling conundrum: Indistinct field names
Qualicorp, a healthcare organization based in Brazil, aimed to enhance lead generation and boost conversions on their health insurance plans page. However, the page was underperforming. Enter VWO Form Analytics from VWO Insights-Web, which proved instrumental in analyzing the user experience.
The form analytics features provided valuable insights into user pain points, tracking metrics such as hesitation rate, ragged clicks, dead clicks, completion time, completion rate, and more. Upon analysis, it became evident that one of the factors contributing to the low form-fill rate was the need for discernible field names during the form-filling process. This, in turn, resulted in fewer users making it to the health insurance plans page.
In response to this insight, Qualicorp implemented an A/B test featuring a new design. The results were impressive, with the new design boosting the conversion rate by a substantial 16.93% in the primary goal.
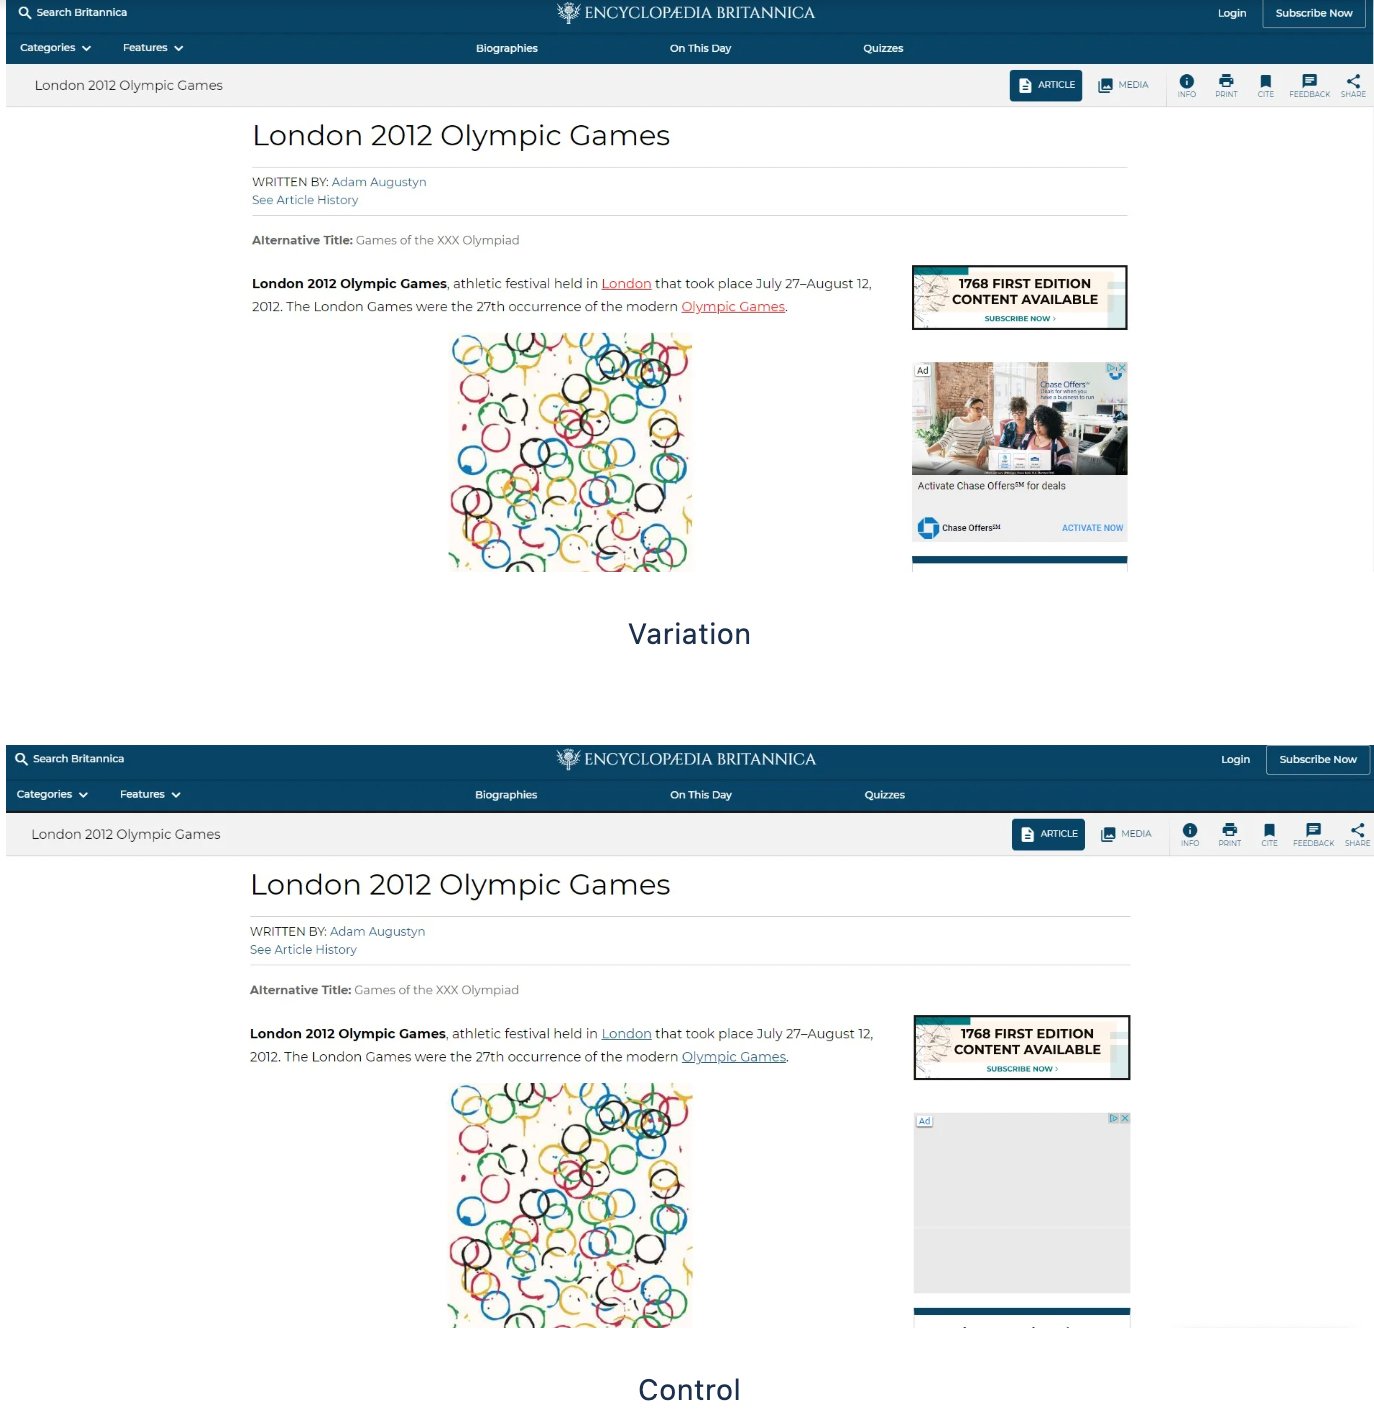
Encyclopedia Britannica Group found blue to be the most engaging link color
The Encyclopedia Britannica Group, a venerable institution with over 250 years of global knowledge leadership, strives to ignite curiosity and enhance engagement with its content to cultivate a robust user base and drive subscriptions.
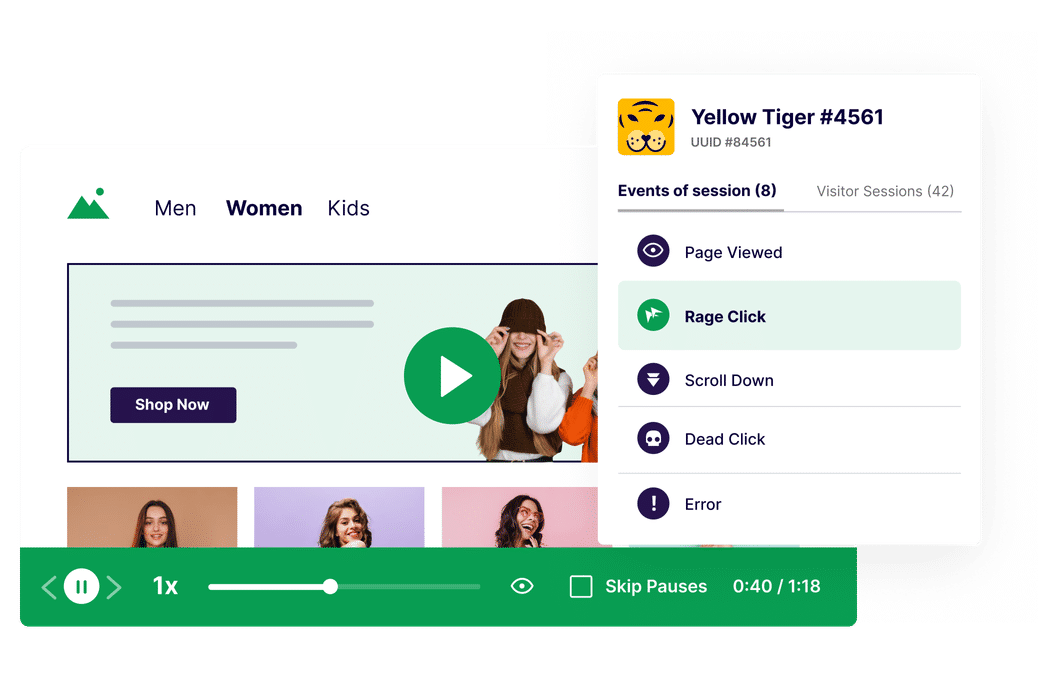
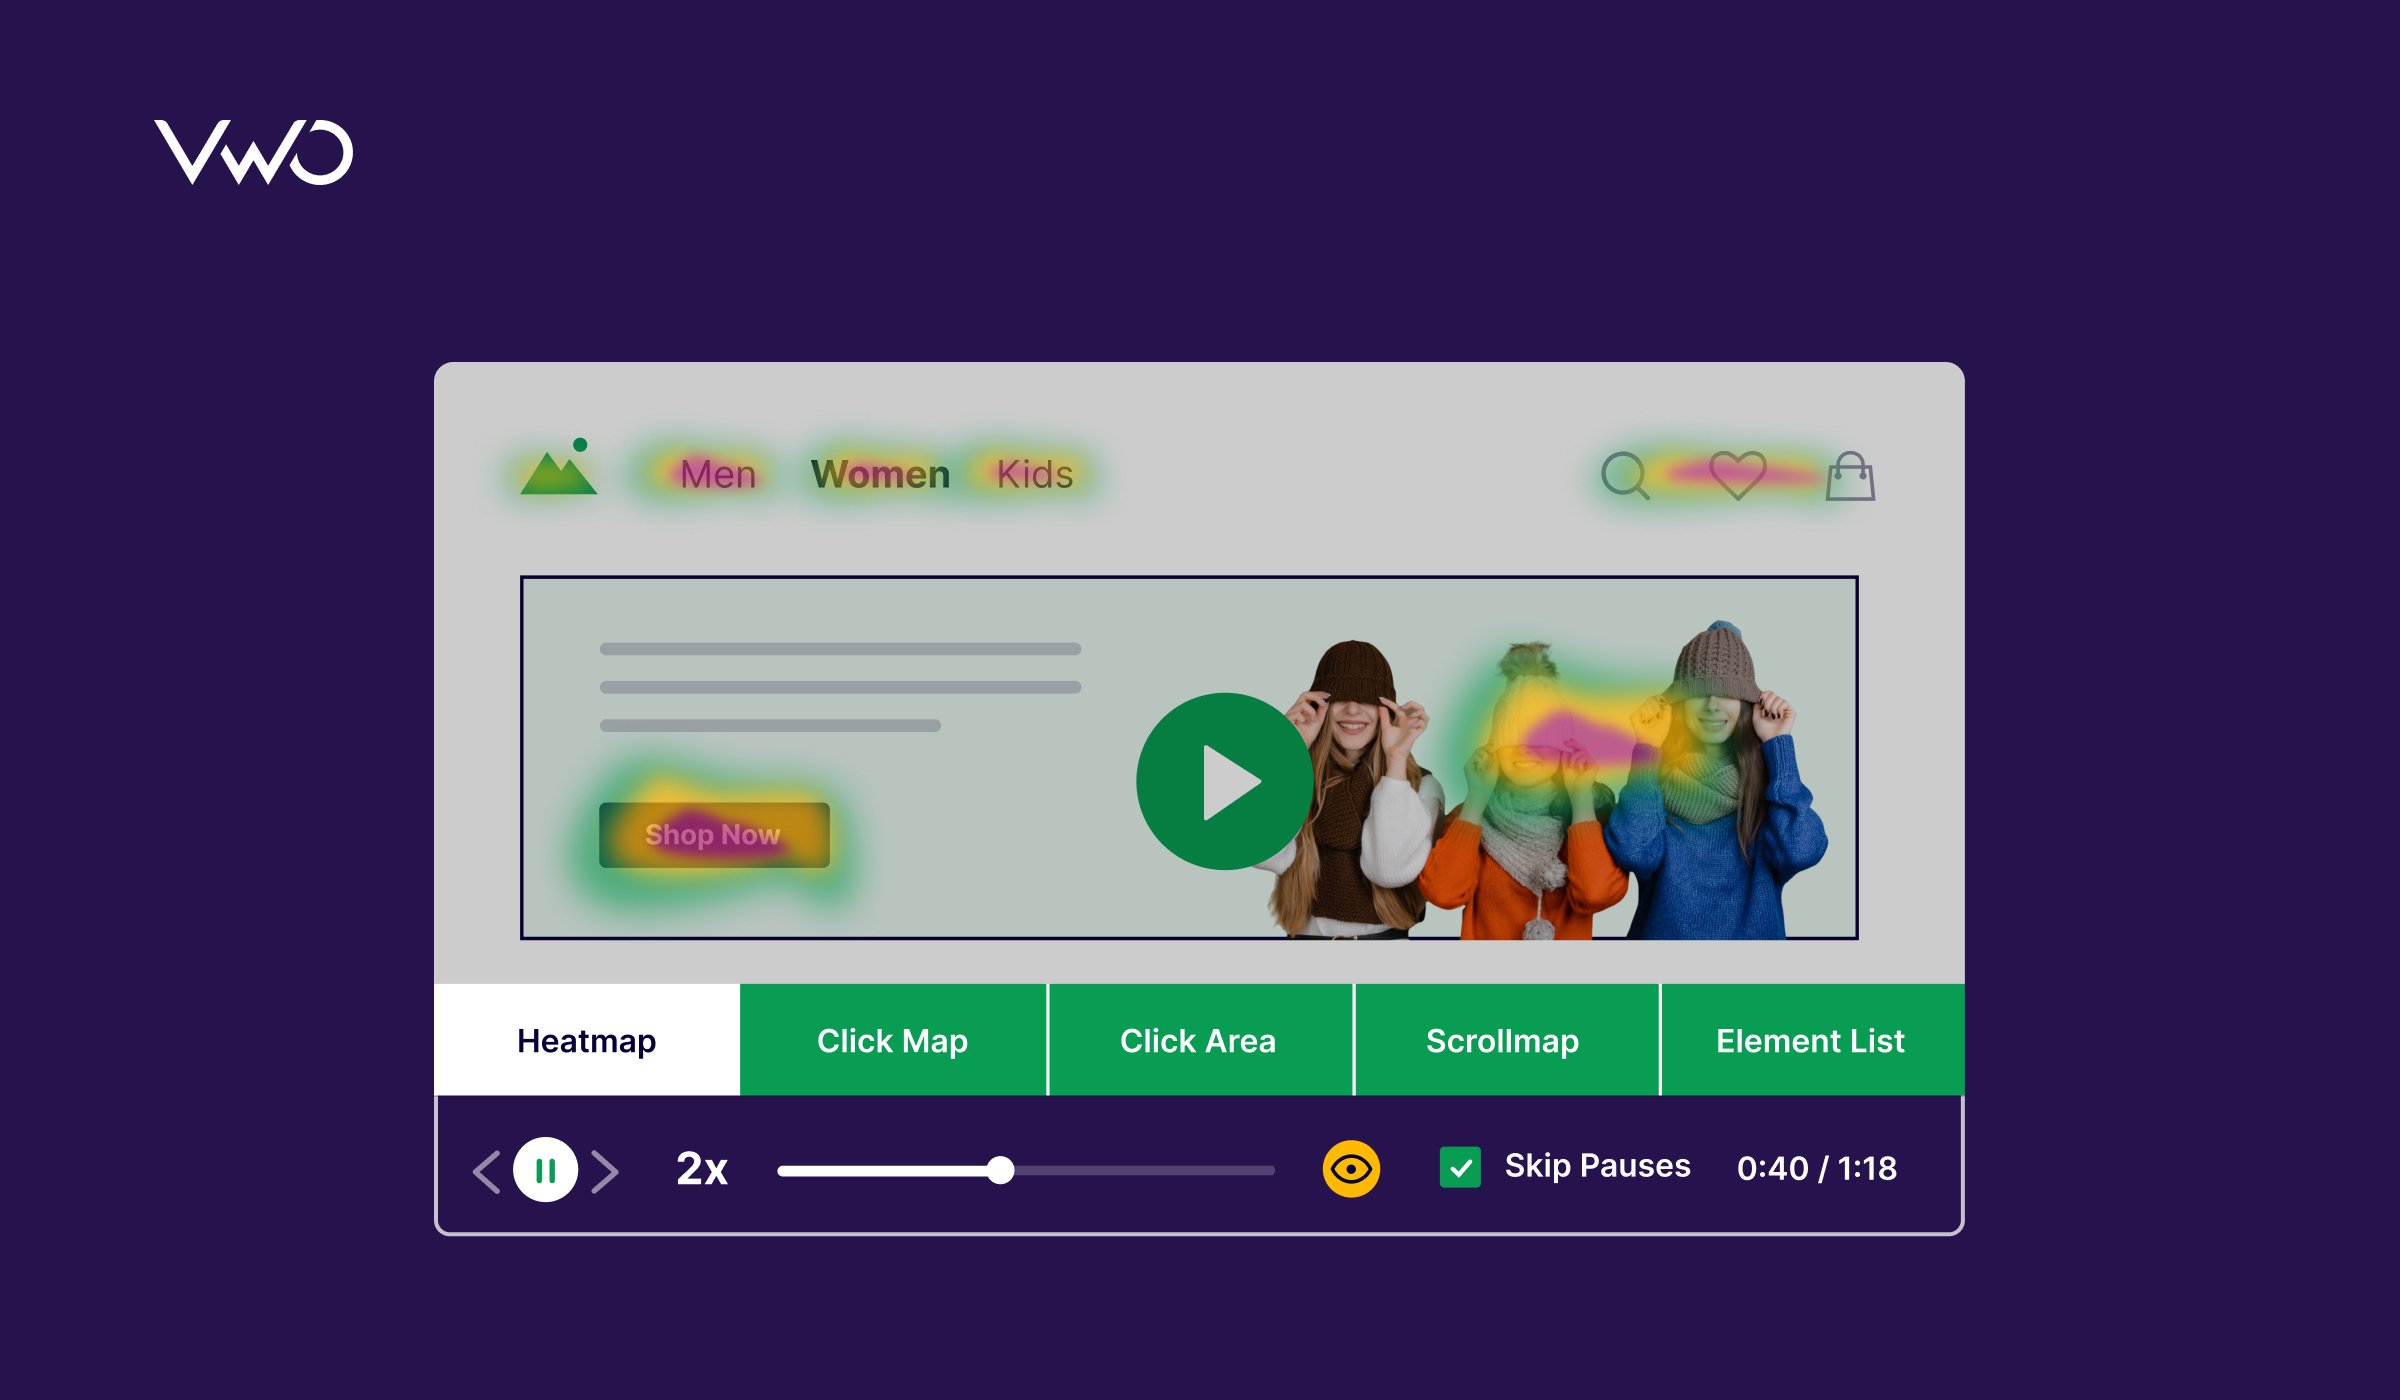
To optimize their approach, the marketing team at the group employed A/B testing through VWO Testing, experimenting with three colors—red, orange, and blue (control)—for in-line article links, coupled with calls to action, to determine the most effective option. Subsequently, the team utilized VWO Session Recordings to delve into click behavior, and mouse flow in order to see how users perceived these different colors.
During this analysis, a noteworthy observation emerged: many users attempted to click on words highlighted in blue, even though these words weren’t actual links. Recognizing this user behavior, the team decided to keep the blue color for the actual links, resulting in a remarkable 10% improvement in their click-through rate.
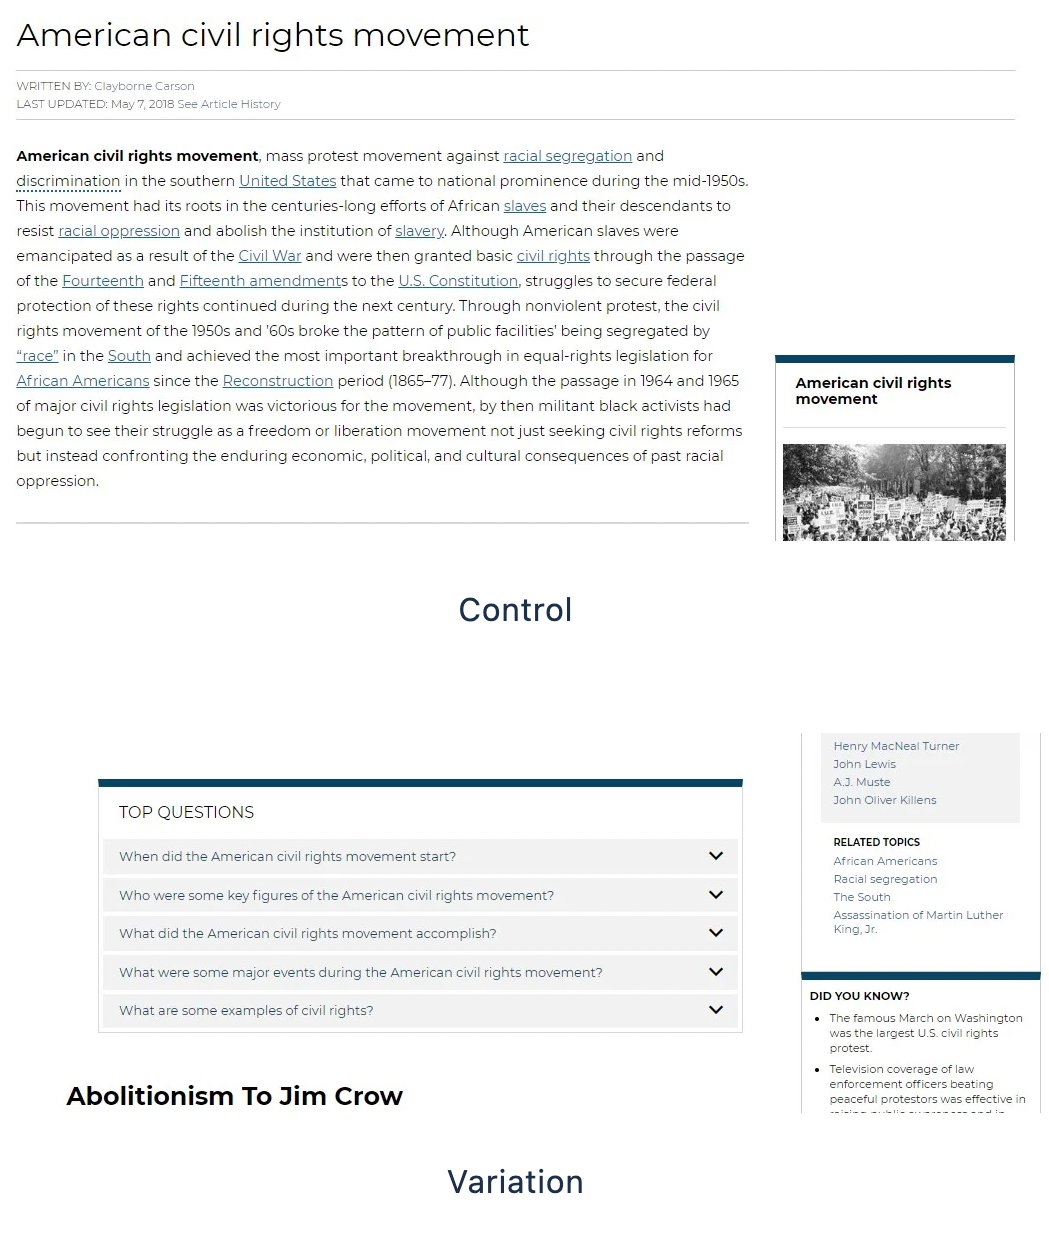
Additionally, the team harnessed VWO On-Page Survey capability to uncover the most pressing inquiries users had about the topic. Armed with this valuable insight, the company took proactive steps by designing an accordion feature on its website, showcasing the top Q&As derived from the survey for each article. The outcome was impressive, with over 23% of users engaging with the accordion to access answers to their questions.
Shopclues improved the product searching process on the navigation bar by focusing on user feedback
Shopclues, a prominent e-commerce player in India catering to 42 million visitors, took a strategic approach to enhance its Conversion Rate Optimization (CRO) initiatives. In a meticulous analysis of each element, the focus was on tracking conversion signals. The tool of choice for this endeavor was VWO Insights -Web, utilized to delve into user behavior on the category page.
Through VWO Heatmap analysis, it became evident that filters such as “new arrivals,” “best selling,” and “price sorting” were capturing the majority of user attention. Users had to navigate by clicking on these filters and then sifting through products to find what they were looking for.
To streamline this process, Shopclues’ CRO team leveraged VWO On-Page Surveys to directly gather feedback from visitors regarding these filters. Armed with valuable insights, a variation was crafted that eliminated the extra step for users. This new approach presented visitors with products matching their chosen filters right away in a horizontal display in the navigation.
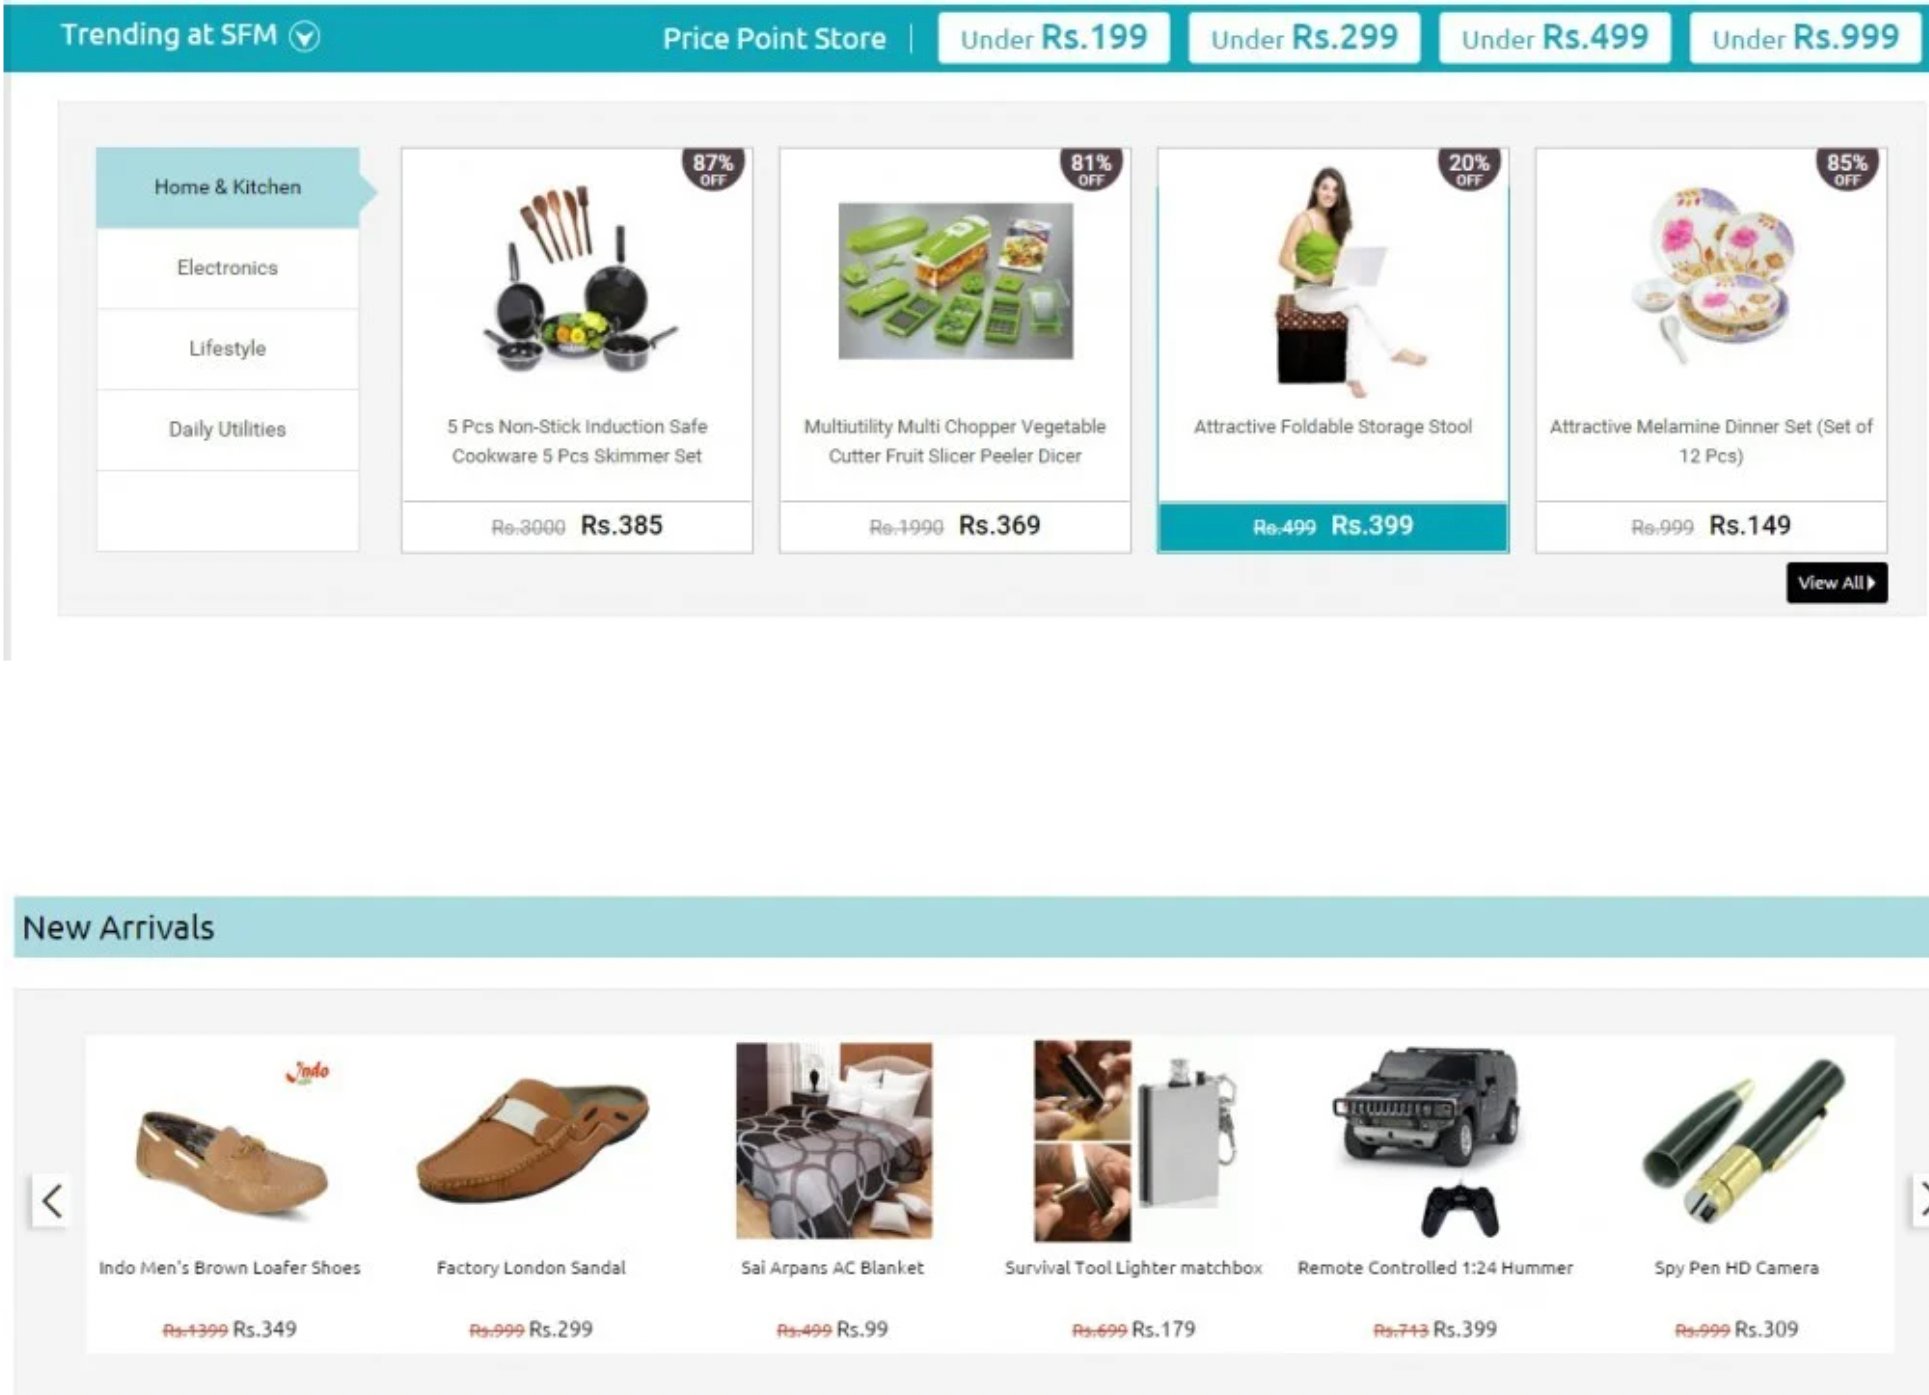
The new top navigation bar delivered 50% more CTR. Not only did the improvement in visits-to-order (48% from the category page) translate to higher revenue, but it also improved the quality of visits.
These three case studies serve as compelling illustrations of how VWO Insights-Web proves to be a valuable tool in addressing common challenges across diverse industries. It excels in pinpointing the root causes behind low conversion rates, showcasing the versatility and effectiveness of this solution.
And does VWO Insights-Web stop here? Not at all; there’s more to explore and leverage.
Beyond optimization: VWO keeps a watchful eye on your user experience
Imagine you’ve honed your user experience using data from VWO Insights-Web or another tool, implementing a series of optimization campaigns over a quarter. As the quarter concludes, assessing the performance of these optimizations becomes crucial. How do you go about it? Well, VWO provides a solution – the Insights Dashboard.
This tool empowers you to effortlessly track and analyze the effectiveness of your optimizations. The dashboard offers a comprehensive view, shedding light on friction points and experience scores derived from user satisfaction, delivering valuable insights into the performance of your enhancements.
Notably, you can easily identify pages with low scores and validate the reasons using heatmaps and scrollmaps. Furthermore, pinpointing visitor segments with low experience scores allows you to tailor customized plans for these segments.
This is just one application
The dashboard is also invaluable in the early phases of behavior research, providing insights into friction points contributing to low conversion rates.
Thus VWO Insights-Web provides comprehensive and versatile solutions throughout the entire lifecycle of website enhancement and optimization efforts. Let’s see what some of our clients have to say about the tool.
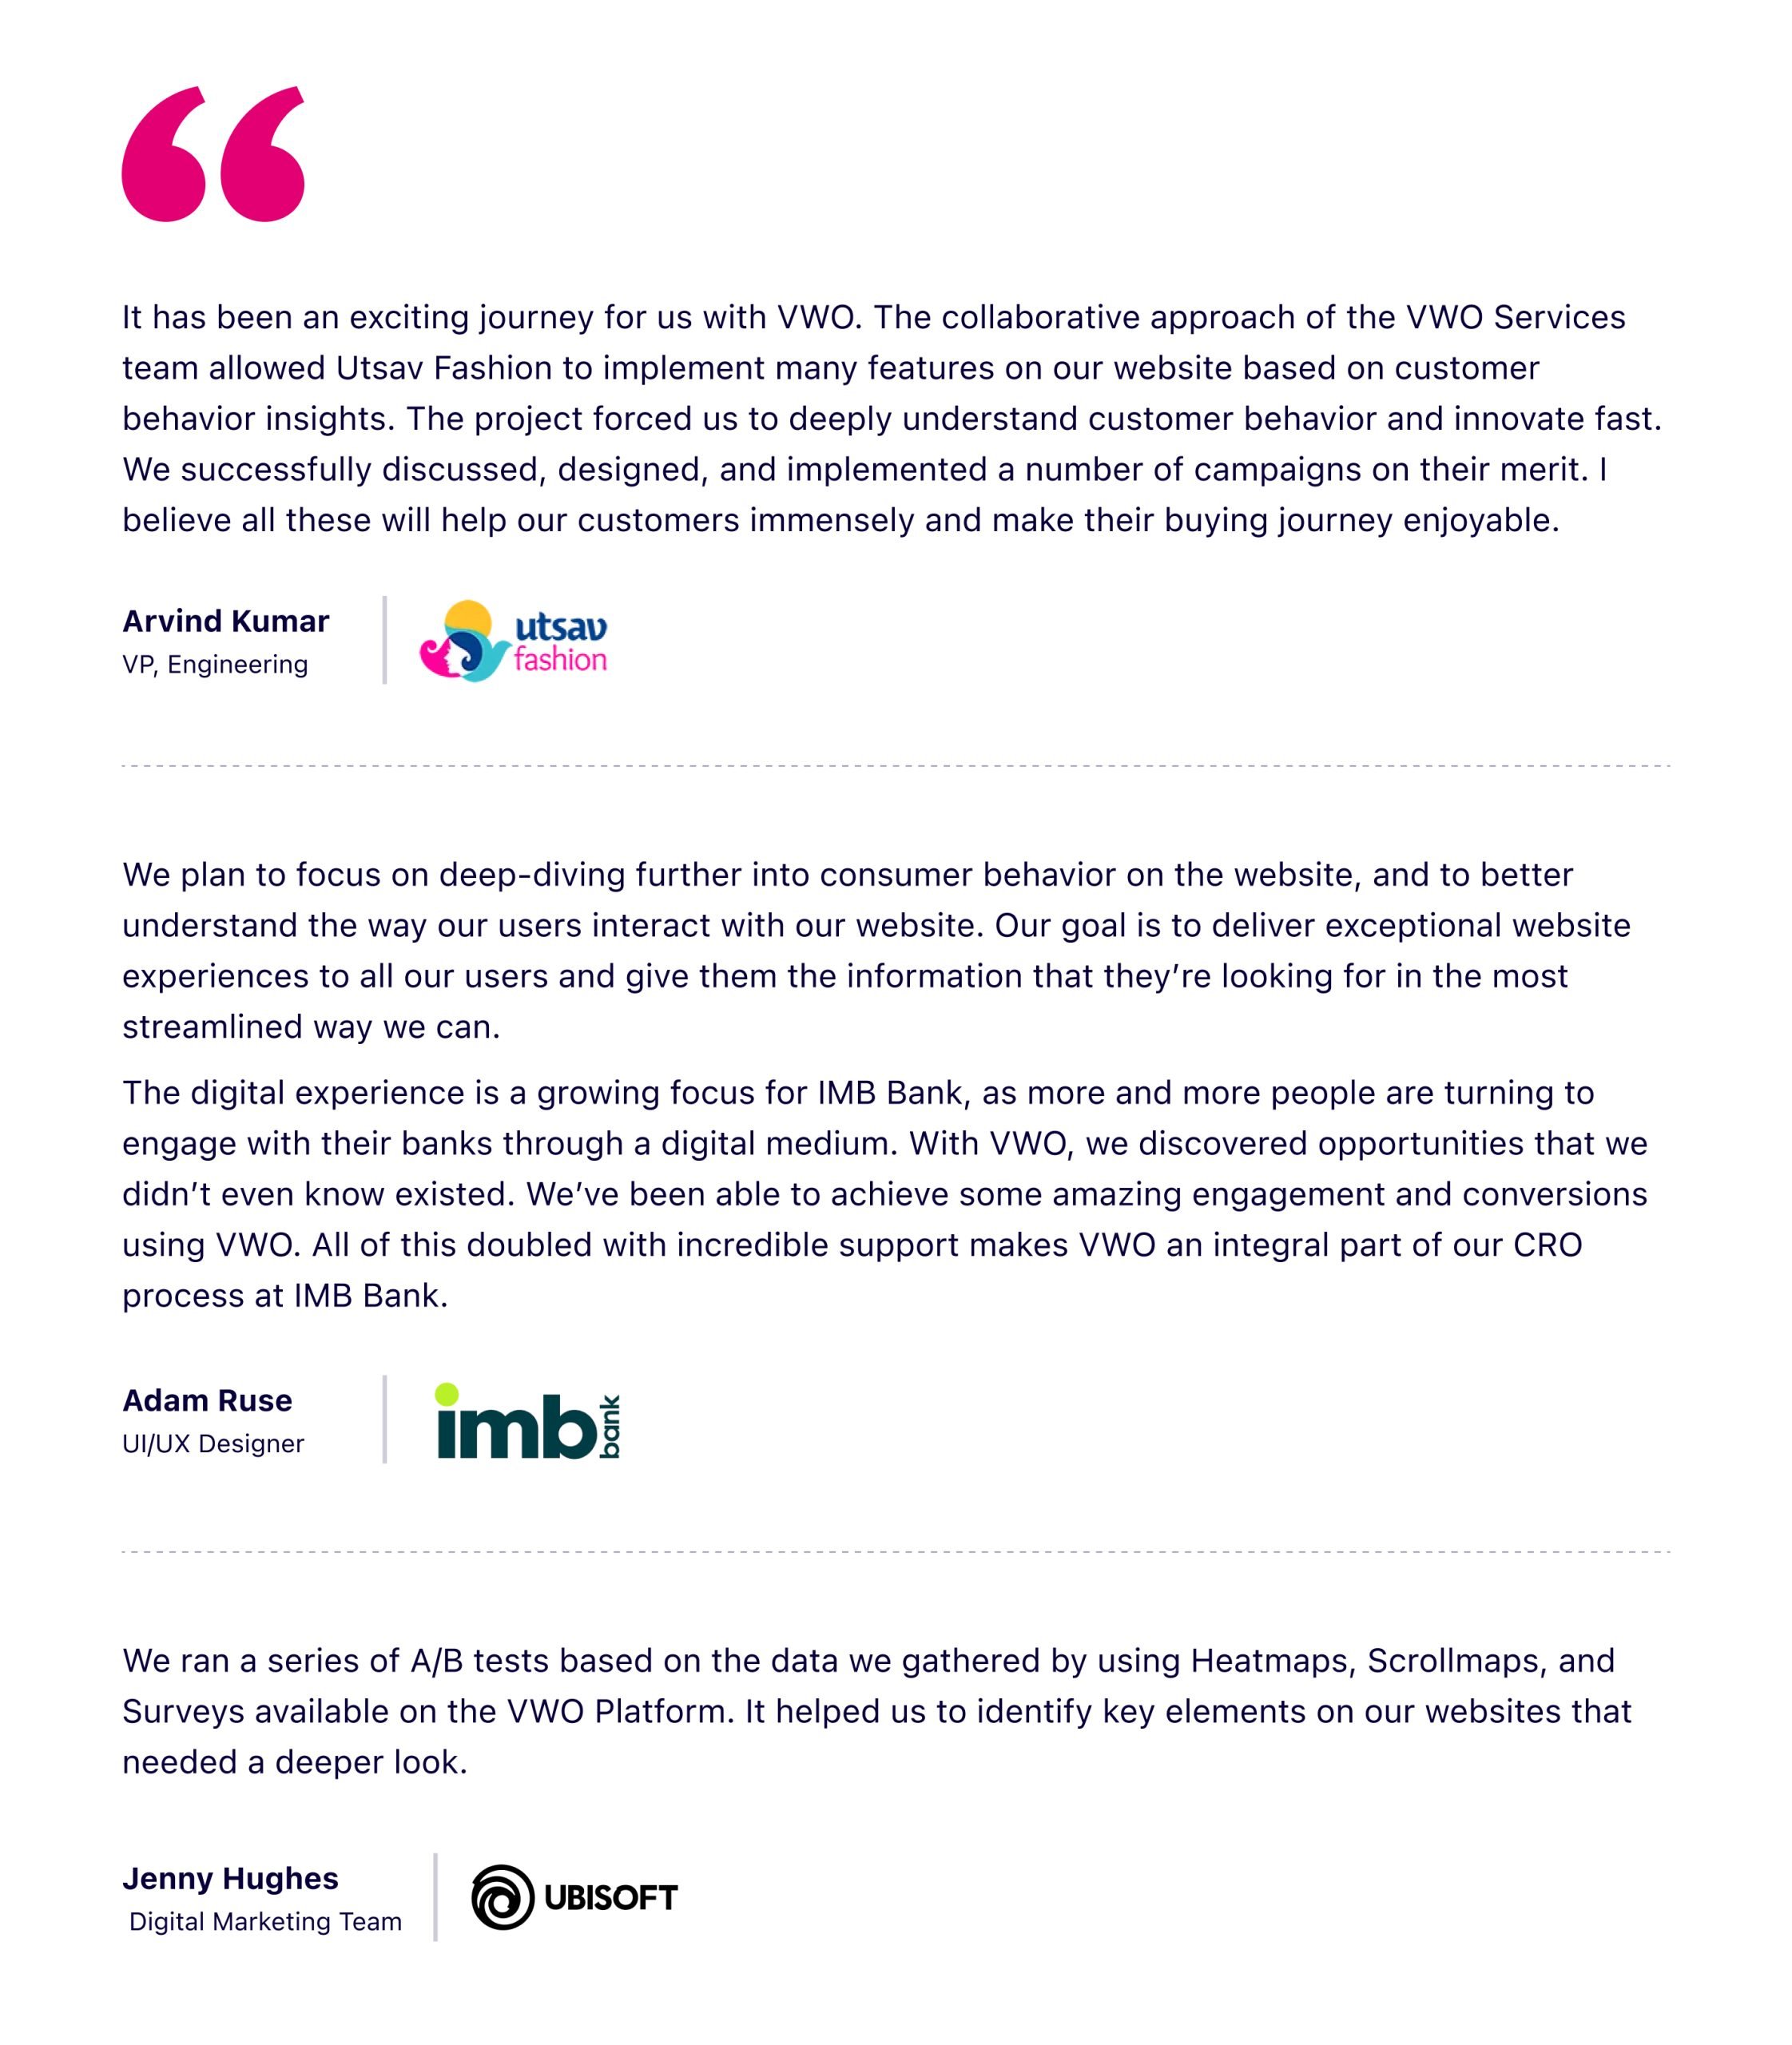
Rave reviews: What users are saying about VWO Insights-Web
In conclusion
VWO Insights-Web is a tool that enables proactive and continuous monitoring of your website experience score. It empowers you to identify issues using features like heatmaps, session recordings, on-page surveys, and form analytics for low-performing pages and visitor segments. Once you formulate a hypothesis, you can seamlessly run an A/B test from the same platform and subsequently track the experience score. This makes it a one-stop shop for the entire experience optimization process.
So, if you’re ready to give it a try, here’s an all-inclusive 30-day free trial of VWO. It encompasses all the capabilities and features that will assist you in making informed business decisions when choosing an optimization tool.
Categories: