

close this to read article
We recommend you to use VWO Test Duration Calculator to find out the approximate time to run your multivariate tests (MVT).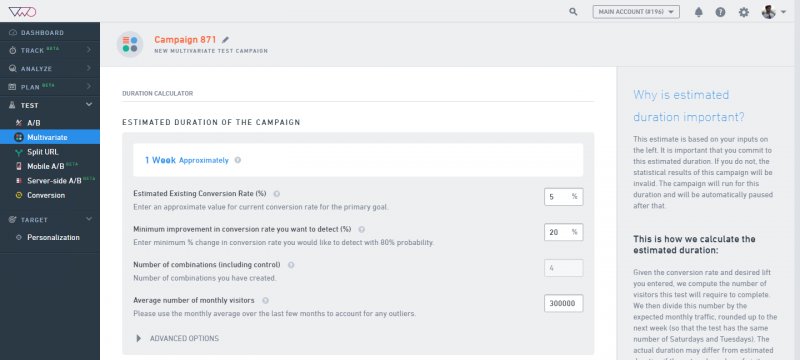
The duration for which you need to run your test depends on several factors such as follows:
- Estimated Existing Conversion Rate (%): The existing conversion rate of your website (the control version). We recommend that you either use Google Analytics (GA) to compute the existing conversion rate or run a VWO Conversion Tracking test to measure this.
- Minimum improvement in conversion rate you want to detect (%): The percentage of improvement in the conversion rate you want to achieve against the existing conversion rate. If the variation actually achieves this level of lift over control, then the test has a 90% chance of correctly declaring the variation as the winner.
- Number of combinations (including control): The total number of variations and combinations you have created for the Multivariate test, including the original (Control) page.
- Average number of monthly visitors: The number of visitors who have been part of the test. The more number of people you test, higher the reliability of the test results.If you do not know this number, we recommend either using Google Analytics to compute it or running a VWO conversion test to measure this. If this number is not accurate, then the estimated duration will not be correct.
- Advanced Options such as:
- p-value cut off: The probability of falsely reporting a winner even when all variations have identical conversion rates.
- statistical power: The probability of detecting a change at least as large as the desired lift. For example, if the desired lift is 10% and statistical power is 80%, then if a variation with 10% lift is present, your test has an 80% chance of detecting it.