How Server Density Increased Its Revenue Using VWO
About Server Density
Server Density provides hosted server and website monitoring services. By monitoring websites from locations around the world and combining internal server metrics, they tell clients when their websites are down and why.
David from Server Density wanted to try whether increasing prices increased overall revenues. He chose VWO, the world’s easiest A/B testing software, to set up and run a test.
Goals
The revenue can be increased either by increasing prices and/or getting more paying customers. The ideal situation would of course be more customers paying a higher price. But as David and his team were contemplating options, they had to grapple with 2 competing hypotheses:
- Increasing prices would reduce free sign-ups.
OR
- Increasing price would increase revenue in spite of reduced sign-ups.
They decided to A/B test to find out which was the more likely outcome. To run these tests, they used VWO.
Tests run
The test was set up with 2 goals:
- Free-trial sign-ups (Goal 1)
- Upgrade (Goal 2)
Goal 1 was considered to be achieved when visitors signed up for a free trial, and Goal 2 when they upgraded to a paid account.
Server Density’s initial pricing page looked like this:
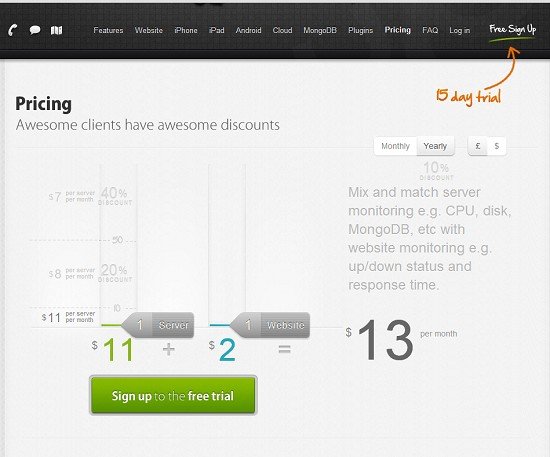
The control was configurable pricing where customers paid based on the number of servers and websites they wanted to be monitored. The assumption was that there is a direct correlation between the number of entities monitored and value provided.
Although the majority of Server Density customers had 7 servers, they chose this pricing structure to cater to first-time, single-server users in the hope of increasing their customer base.
Notwithstanding the fact that most of the customers of Server Density complained about their prices, they decided to A/B test a new “packaged” pricing structure where the lowest package started from US$99 per month. Here’s the variation screenshot:
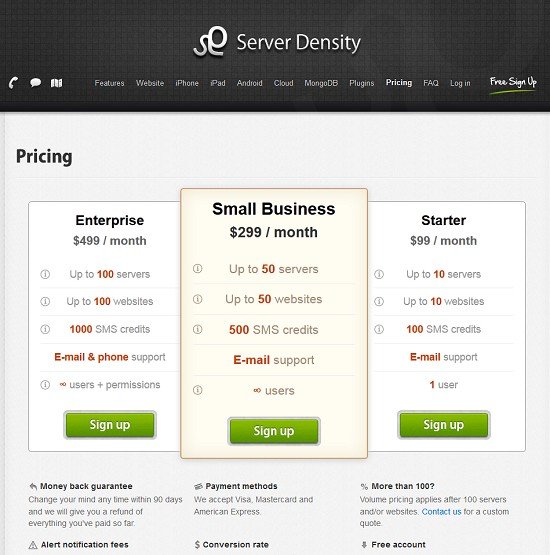
Under the old plan, the price for monitoring 10 servers and 10 websites would have been US$130 per month, whereas under the new plan, the price for 10 monitoring servers and 10 websites would be US$99.
So the company dropped prices but increased the average order value (AOV).
Conclusion
The results were interesting. Although the number of free sign-ups dropped by 24.96%, the total revenue increased by 114%.
The test results are summarized below:
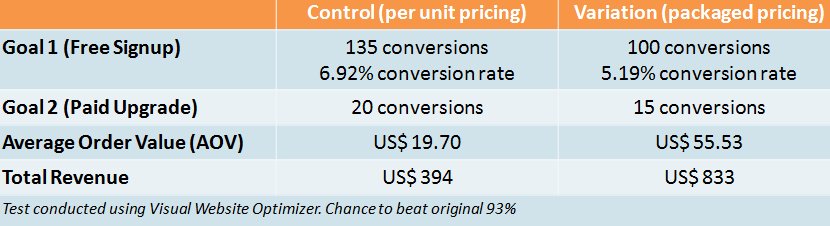
Goal 1: Free sign-up
Control (per unit pricing): 1,950 visitors, 135 conversions, 6.92% conversion rate
Variation (packaged pricing): 1,925 visitors, 100 conversions, 5.19% conversion rate
Goal 2: Paid upgrade
Control (per unit pricing): 1,950 visitors, 20 conversions, US$19.70 AOV, total revenue US$394
Variation (packaged pricing): 1,925 visitors, 15 conversions, $55.53 AOV, total revenue $833
A/B testing is a powerful technique not only because it is objective but also because it allows us to gather key insights about customer behavior.
It is important to get pricing right and the best way to do so is to test hypotheses with real data. Most customers care more about the value they derive rather than how much it costs you to provide your service. Therefore, base your prices on what your product/service is worth to your customers and not on how much it costs you or the profit you want to make per sale.

david mytton
CEO
Customer preferences change, as do competitor actions. Therefore, always be testing, so you don’t leave money on the table (think pricing packages, pricing displays, promotional offers etc.)

Location
London, UK
Industry
Software
Impact
114% increase in Revenue